October 15, 2024
4 min read
Contributors to Scientific American’s November 2024 Issue
Writers, artists, photographers and researchers share the stories behind the stories

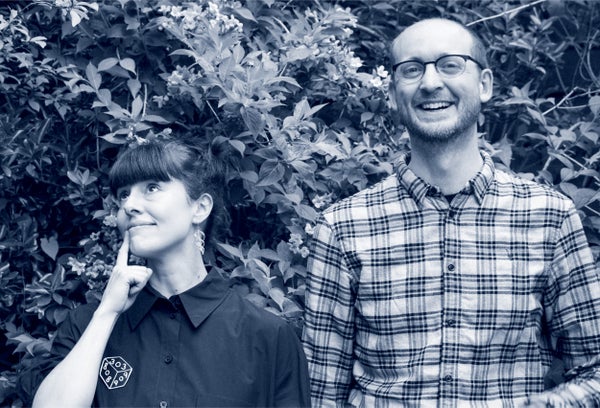
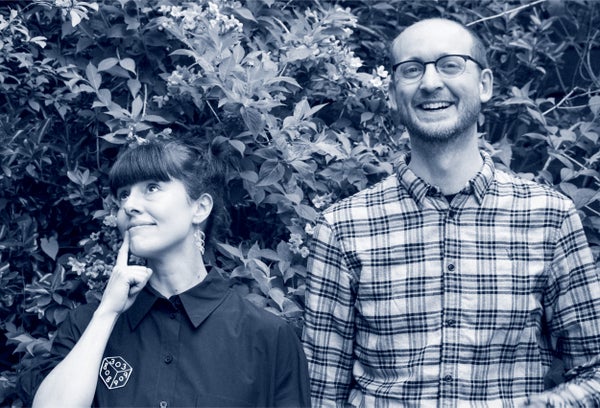
Miriam Quick and Duncan Geere.
Duncan Geere and Miriam Quick
Graphic Science
On their podcast, Loud Numbers, Miriam Quick and Duncan Geere (above) turn data into music. There’s a techno track charting climate change, a fugue about European bureaucracy, an experimental epic about beer tasting, and more. “You get to ride the waves of the data, moment to moment, in a much more emotionally resonant way” than looking at a graph, Geere says.
As data journalists and storytellers, they use both sonification and visualization to make complex information understandable to our ears and eyes. For this issue’s column on music evolution, with text by associate news editor Allison Parshall, Quick and Geere were challenged to represent a song as a visual graph. Quick studied music-performance styles for her Ph.D. in musicology, so she has experience using data to “understand the music in a different way,” as she puts it. Geere, who came to data journalism from an earth sciences background, is also passionate about music; he DJs and plays in bands.
On supporting science journalism
If you’re enjoying this article, consider supporting our award-winning journalism by subscribing. By purchasing a subscription you are helping to ensure the future of impactful stories about the discoveries and ideas shaping our world today.
Their graphic uncovers and maps key similarities among pieces of traditional music from all over the planet. “It suggests that music, or song specifically, occupies a stable position across cultures,” Quick says—that is, we humans sing for a common reason.
Luisa Jung
Solutions for Health Equity
Early in her career as an architect, Luisa Jung realized something was missing. “The world of ideas, of images,” was what she loved the most, she says—but not so much turning those ideas into buildings. Jung had moved from Argentina to Germany and was captivated by the illustrations in her new country’s newspapers. So she began building a portfolio of her work. “At first I was kind of afraid to draw, so my style was collage,” she says, but soon she was dabbling in watercolor and then woodblock printing.
Now an illustrator, Jung lives happily in the world of ideas and metaphor. In this issue’s special report on innovations in health equity, her illustrations give form to concepts that can be hard to visualize, such as cultural competency and data disaggregation, but that nonetheless have real consequences for people’s health. These kinds of visual metaphors—representations such as an hourglass of mpox and data as a curtain that can obscure reality—come to her naturally. “It’s the way my brain works,” she says. Jung aims to “represent complex topics in a way that is also kind of poetic.”
Stephani Sutherland
No More Needles
Health journalist Stephani Sutherland has long been fascinated by pain; it was the subject of her Ph.D. research. “You can’t survive very well without it, but if you have chronic pain, it can become really debilitating,” she says. So when COVID began causing painful, long-term illness and neurological symptoms, she paid close attention. This condition, called long COVID, is an example of something scientists began to fully understand only in the past few decades. “The nervous system and the immune system are not separate like we were once taught,” Sutherland says.
The connection between chronic pain and the immune system has since sparked her interest in immunology. Sutherland’s feature in this issue explores a type of needleless vaccine that goes in the nose, not the arm, and could one day provide better immunity to infectious diseases. Nasal vaccines aren’t a reality for everyone yet—“we’re in early days,” Sutherland says. But they could be safer to administer in places with poorer access to medical equipment and even at home. And because they provide immunology inside the nose itself, “you can nip the virus in the bud right where your body encounters it,” she says. “That seems really powerful to me.”
Jyoti Madhusoodanan
Defogging Data
Nineteen years ago Jyoti Madhusoodanan moved from Ahmedabad, India, to Buffalo, N.Y., to complete a Ph.D. in microbiology. That was when she started having to check a box on forms to indicate her race—and found that the entirety of Asia and the Pacific Islands was lumped into a single category. She recalls thinking, “Asia is massive! How is this helpful to anyone?” The issue remained on her mind for years as she moved from New York to the West Coast and began her career as a science journalist covering health.
As Madhusoodanan lays out in her article for our special report on innovations in health equity, this giant category is used all the time in medicine and health research—and not only is it unhelpful, as she initially suspected, but it does harm. This pooling of data hides important signals that could be used to save lives. In recent years this practice has finally begun to change, a mark of progress that “has been painfully won by people of these communities that have been invisible,” Madhusoodanan says. Everyone she spoke with for the story “had a deep, deep personal connection to fixing this.”

